
Your First Steps into Python for Data Analysis: A Beginner's Guide
- Jan 22
- 7 min read
Updated: Jan 22
If you're reading this, chances are you've heard that Python is transforming how people work with data. Maybe you've seen colleagues turning spreadsheets into stunning insights in minutes, or perhaps you've noticed more job postings asking for Python skills. But here's the question that might be holding you back: "Can I really learn this if I've never coded before?"
The answer is yes. Our latest article is going to show you exactly how.
Why Python has become the language of data
Let's start with a truth that might surprise you: you don't need to become a programmer to use Python for data analysis. Think of Python as a tool, like Excel but more powerful. Just as you learned Excel without becoming a software engineer, you can learn Python without becoming a developer.
Python has become the industry standard for data analysis for some compelling reasons. It's free and accessible to anyone with a computer. The community supporting it is massive and welcoming to beginners. Most importantly, it handles the real-world messiness of data better than almost any other tool out there.
When you work with data in your job, it's rarely clean and perfect. Dates are formatted inconsistently, values are missing, columns have confusing names, and information is scattered across multiple files. Python, specifically through a library called Pandas, excels at cleaning up this chaos and transforming it into something useful.
What makes Python special is its versatility. You can start by loading a simple CSV file and calculating some basic statistics. As you grow more comfortable, you can create sophisticated visualizations, automate repetitive reports, and even build predictive models. You won't outgrow it.
What Does Data Analysis with Python Actually Look Like?
Let us paint a picture of what you'll be able to do once you have these skills.
Imagine you're in marketing and you receive a spreadsheet with thousands of customer transactions. Your boss wants to know which customer segments are most valuable and what products they're buying together. In Excel, this would mean hours of manual filtering, pivot tables, and chart creation. With Python, you write a few lines of code that analyze everything in seconds and produce professional visualizations you can immediately present.
Or maybe you're in operations and you need to spot trends in monthly sales data going back five years. Instead of manually reviewing hundreds of rows and creating separate charts for each product category, Python can process everything at once, identify patterns, and show you exactly where the opportunities and problems are.
Perhaps you work in HR and need to analyze employee satisfaction survey results from multiple departments. Python can help you clean the responses, calculate meaningful statistics for each team, and create compelling visualizations that tell the story behind the numbers.
The common thread in all these scenarios? Python lets you ask questions of your data and get answers quickly. It removes the tedious manual work and frees you up to focus on the insights and decisions that actually matter.
The Three Pillars of Python Data Analysis
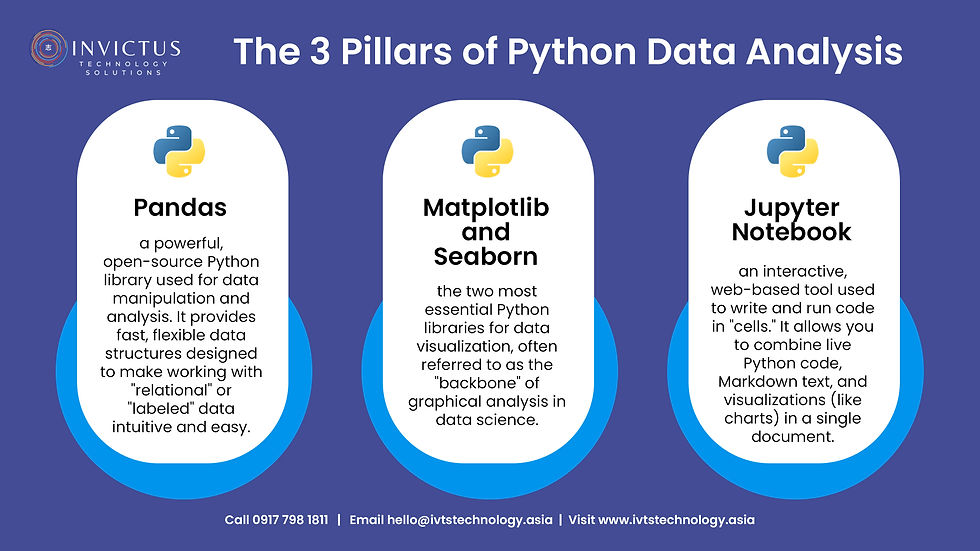
When you learn Python for data work, you'll master three core tools that handle different parts of the process.
Pandas is your data manipulation powerhouse. This library lets you load files, clean messy data, filter information, calculate statistics, and reshape datasets. If you've used pivot tables in Excel, Pandas does similar things but with far more power and flexibility. It's the workhorse that you'll use in almost every data project.
Matplotlib and Seaborn turn your numbers into visuals. Bar charts, line graphs, scatter plots, heatmaps. These libraries help you create professional visualizations that communicate your findings clearly. Good charts can make the difference between insights that get ignored and insights that drive action.
Jupyter Notebook is your interactive workspace. Instead of writing code in one place and seeing results somewhere else, Jupyter lets you write a bit of code, immediately see what happens, document your thinking, and continue. It's like having a digital lab notebook where you experiment, analyze, and document all in one place.
What You'll Learn in Just 7.5 Hours
Here's something you might not expect: you can go from absolute beginner to analyzing real datasets in a surprisingly short time if the training is focused and practical.
The Practical Data Analysis Using Python course offered by Invictus Technology Solutions is designed specifically for people with zero programming experience. Over three evening sessions, you'll build a complete foundation in Python data analysis.
On Day 1, you'll get comfortable with Python basics. You'll learn to use Jupyter Notebook, understand variables and data types, and work with lists and dictionaries. Most importantly, you'll start using Pandas to load and explore actual datasets. By the end of the first session, you'll already be working with real data, not abstract programming exercises.
Day 2 focuses on the messy reality of data work. You'll learn to handle missing values (because real data always has gaps), rename confusing columns, filter out noise, and sort information. Then you'll dive into analysis: calculating statistics, grouping data by categories, and performing conditional analysis to answer specific questions. This is where things click for most people, when you see Python solving actual problems you face at work.
Day 3 brings it all together with visualization and interpretation. You'll learn to create bar charts, line graphs, and pie charts using Matplotlib and Seaborn. More importantly, you'll practice the critical skill of identifying trends and patterns in your data and translating numbers into insights that drive decisions.
Each 2.5-hour session is hands-on. You're not just watching someone demonstrate. You're writing code, making mistakes, fixing them, and building confidence. You'll leave with working code you can reference and adapt for your own projects.
Why This Approach Works for Beginners
Not all Python courses are created equal, especially for people without technical backgrounds. Here's what makes this training different.
It's beginner-friendly from the start. The course assumes zero programming experience. Our trainers are Python experts, has spent over a decade teaching people who've never written a line of code. They know where beginners get stuck and how to explain concepts in ways that make sense.
You learn by doing immediately. Every concept is applied to real data right away. This isn't theory followed by practice. It's learning and doing simultaneously, which helps concepts stick.
It's focused on practical skills. You're not learning computer science fundamentals you'll never use. Every topic directly relates to analyzing data you might encounter in business, operations, marketing, or finance.
The schedule fits working professionals. Three evening sessions from 7:00 PM to 9:30 PM means you don't have to take time off work or sacrifice entire weekends. It's designed to fit into your life.
Small class sizes ensure interaction. This isn't a massive online course where you're one of thousands. Limited seats mean you get guided experience, can ask questions, and receive personalized attention when you're stuck.
Who Should Take This Course?
If you're wondering whether this training is right for you, here's who typically benefits most:
You're working with data in Excel and feeling its limitations. You know there must be a better way to handle larger datasets, more complex analysis, or repetitive tasks that eat up your time.
You're a professional looking to stand out. Python skills are no longer just for programmers—they're becoming essential across industries. Adding data analysis with Python to your skillset immediately differentiates you from your peers.
You're a career changer exploring data analysis. Maybe you've been curious about the field but weren't sure where to start. This course gives you hands-on experience to determine if data work is a path you want to pursue further.
You're a manager or decision-maker who wants to understand what's possible. Even if you won't be doing the analysis yourself, understanding Python's capabilities helps you ask better questions of your analytics team and make more informed decisions.
You're a student or recent graduate looking for marketable skills. Data literacy is becoming as fundamental as Excel proficiency. Starting with Python puts you ahead of graduates who only know spreadsheets.
The one thing all successful students have in common? Curiosity and willingness to practice. Technical background is not required. If you can use a spreadsheet and you're ready to learn something new, you're qualified for this course.
The Real Benefits of Learning Python Now
Let's talk about what changes when you have Python skills.
Independence. Every day you wait is another day you're dependent on someone else to analyze your data. This course gives you the ability to answer your own questions. Need to know which products are trending? Run the analysis yourself. Want to understand customer behavior? You don't have to wait for the analytics team.
Efficiency. Repetitive tasks that currently take hours can be automated. Write a script once, and run it every week with fresh data. No more copying, pasting, and manually updating reports.
Career advancement. Python is increasingly listed as a required or preferred skill in job postings across industries. It's not just for data scientists—marketers, operations managers, financial analysts, and business strategists are all using Python to work smarter.
Confidence with technology. Learning Python builds your comfort with technology in general. You'll find yourself less intimidated by new tools and more willing to explore what's possible.
A foundation that grows. This course teaches you how to think about data problems, not just what buttons to click. You'll leave with the confidence and knowledge to continue learning, whether through online resources, advanced courses, or simply tackling projects at work.
Your Next Step: Reserve Your Spot
Here's the reality: data isn't going away. In fact, organizations are generating more of it every year, and the demand for people who can make sense of it is only increasing.
You have two choices. You can keep doing what you're doing—relying on others for analysis, spending hours on manual tasks, or wishing you had these skills. Or you can take 7.5 hours over three evenings and change what's possible for you professionally.
Seats are intentionally limited to ensure an interactive, guided experience. The training is delivered virtually, so you can join from anywhere with an internet connection.
To register or learn more:
Visit the course page: Practical Data Analysis Using Python
Call 0917 798 1811
Stop waiting for the perfect time or for your organization to send you to training. The perfect time is now. The best investment you can make is in your own capabilities.
Your future self—the one analyzing data confidently, automating repetitive tasks, and standing out in your field—will thank you for taking this step.


Comments